 In our ongoing discussion of car audio electrical theory, we need to discuss some of the characteristics of alternating current signals. These points of discussion include the concept of amplitude and frequency. Understanding the concept of frequency is crucial to developing an understanding of how the components in our audio systems work.
The Concept of Signal Amplitude
Thankfully, we are going to start off easy with a discussion of signal amplitude. When it comes to the ability of an AC signal to do work, just as with a DC power source, more amplitude (or level) means that more work can be done.
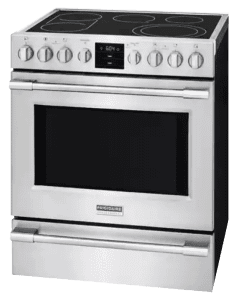 In a DC power source, the amplitude is fixed at a certain level. In our cars, this level is around 12 volts. In our homes, the voltage at the wall receptacle is 120V. High-power devices like an electric stove, a clothes dryer or an air conditioner are typically powered by 240V to reduce the amount of current required to make these devices operate.
When we want to reproduce sound, we need to supply an audio signal from an amplifier to the voice coil of a speaker. Ignoring the design limitations of a speaker, supplying more voltage results in the cone moving farther and thus producing more sound.
If our amplifier is producing 1 volt rms of signal to a speaker with a nominal impedance of 4 ohms, then the speaker is receiving 0.25 watts of power (calculated using the equation P = V^2 ÷ R). If we increase the voltage to 2 volts, the power at the speaker is now 1 watt ((2×2) ÷ 4). If the voltage increases to 10 volts, the power is now 25 watts.
If we were to look at the two signals described above (1Vrms and 2Vrms) on an oscilloscope (a device that shows voltage relative to time), you would see the following:
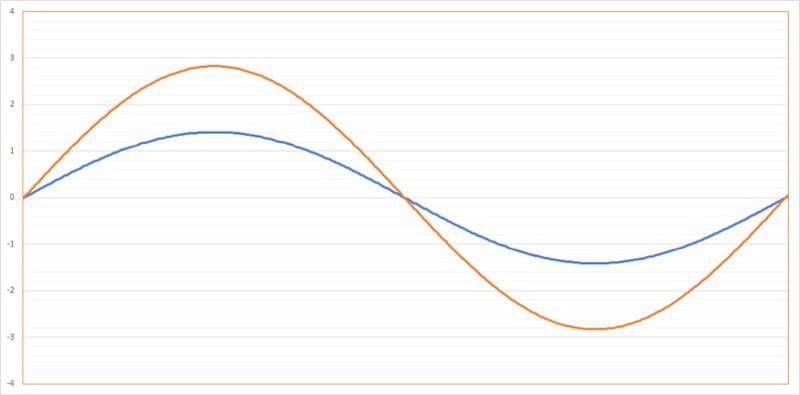 Just a reminder: The RMS value of a sine wave is 0.707 times its peak value. In the case of these waveforms, the peak values would be 1.414 and 2.818 volts.
The Concept of Frequency
Signals Containing Multiple Frequencies
Let’s step back a bit and look at the fundamentals of analyzing the frequency content of a signal. The graph you see below shows a single 1kHz signal.
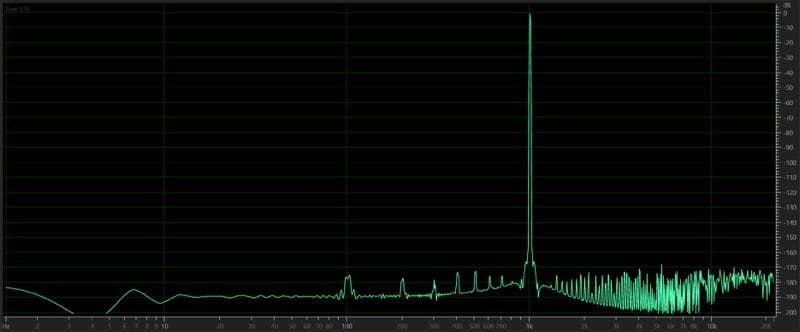 The “stuff” you see at the bottom of the screen is noise. Every signal contains some amount of noise. For this graph, we can see that the 1kHz signal is recorded at a level of 0dB and that the loudest noise component is almost 170dB quieter. This low amplitude makes the noise level irrelevant.
What can be difficult to understand is that a signal can be, and often is, made up of many different frequencies. This graph shows an audio signal that contains 1kHz and 2kHz signals.
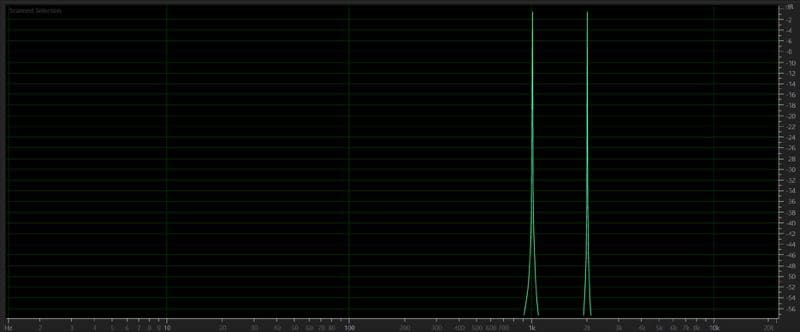 Almost every audio signal we hear comprises an infinite number of frequencies. The relative level of these frequencies is what makes one person’s voice sound different than another’s or makes a piano sound different than a guitar.
These two frequency response graphs show a piano and a guitar both playing Middle C with a frequency of 256 Hz.
The red line represents the response of the guitar, showing a peak at 256 Hz, a strong harmonic at 512 Hz and an intermodulation peak at 768Hz.
The green line shows the frequency response of a piano playing the same 256 Hz middle C note. It has significantly more harmonic content with harmonics and intermodulation peaks above and below the fundamental.
Audio Measurement Waveforms
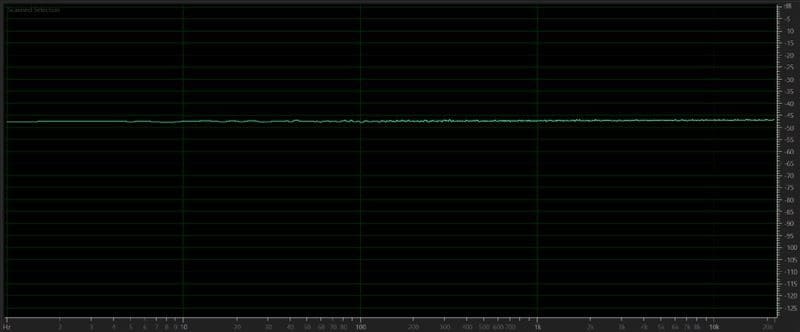
Two waveforms are commonly used to test audio equipment and audio signals. The first is called a white noise signal. This signal includes random audio signals at all frequencies up to the cutoff of the recording medium (in this case, 22.05kHz or our 44.1kHz sampling rate WAV file). Each frequency is the same in terms of amplitude. We can use this signal along with a real-time analyzer to measure the frequency response of audio components.
Here is the frequency response plot of a white noise signal:
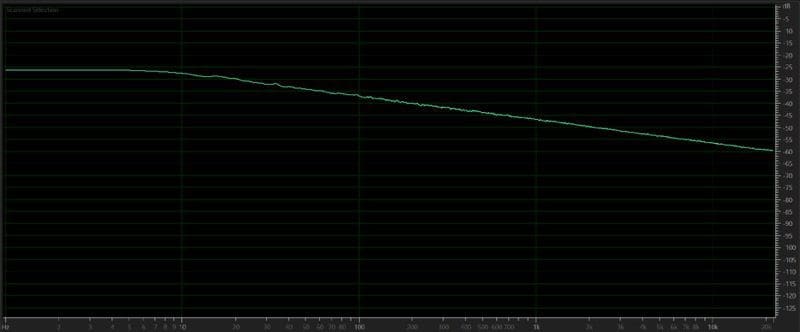
 Another important signal is called pink noise. We use this signal when measuring the frequency response of a speaker. Unlike white noise that contains signals at equal levels at all frequencies, pink noise has an equal amount of signal energy per octave. When looked at in the frequency domain, the level decreases at a rate of 10dB per octave as frequency increases.
 When you play pink noise through a set of speakers and measure the response with a microphone, you will be looking for a flat waveform.
Frequency Response of a Loudspeaker
Let’s take a high-quality, 6.5-inch coaxial speaker with a specified efficiency of 89dB when supplied with pink noise at a level of 2.83V and measured at a distance of 1 meter. A value of 2.83 volts happens to work out to 2 watts using the P = V^2/R equation.
While this specification works when we feed the speaker a pink noise signal, it doesn’t tell us how loud the speaker is at a specific frequency. For that, we need a frequency response graph.
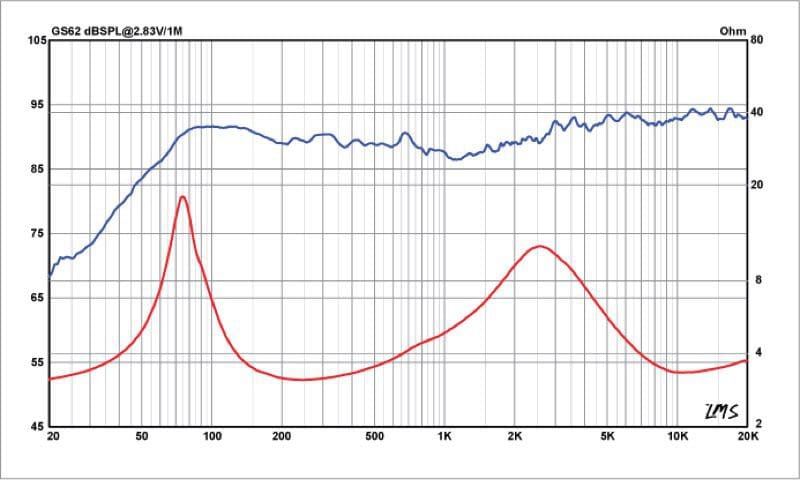 This frequency response graph shows us how much sound energy this speaker will produce when driven by a pink noise signal.
This particular driver has a gentle dip around 1kHz, some emphasis in the mid-bass region between 80 and 150Hz and a gently rising response above 2kHz to improve off-axis performance. In a car, this speaker sounds amazing!
The Bonus Signal – A Square Wave
OK, strap on your space suit, thinking cap or whatever will help you understand the following. We are going to look at a square wave. A square wave is a waveform that combines harmonics (multiples) of a fundamental frequency to create a waveform of a specific shape. The waveform appears to have two values, one high and one low. It’s for this reason that people incorrectly assume that these are Direct Current (DC) levels.
The formula to create a square wave is made up of multiple odd-ordered harmonics of the fundamental frequency. If you have a 30Hz square wave and look at it in the frequency domain, you can see these harmonics.
When an amplifier is pushed beyond its output voltage limit, it creates a square wave. There is no DC content in the signal, but it IS full of high-frequency harmonic content.
Using an Excel spreadsheet created by Alexander Weiner from Germany, here are six graphs that show how a square wave is created by adding odd-ordered harmonics to a fundamental signal. For a perfect waveform, we need an infinite number of harmonics.
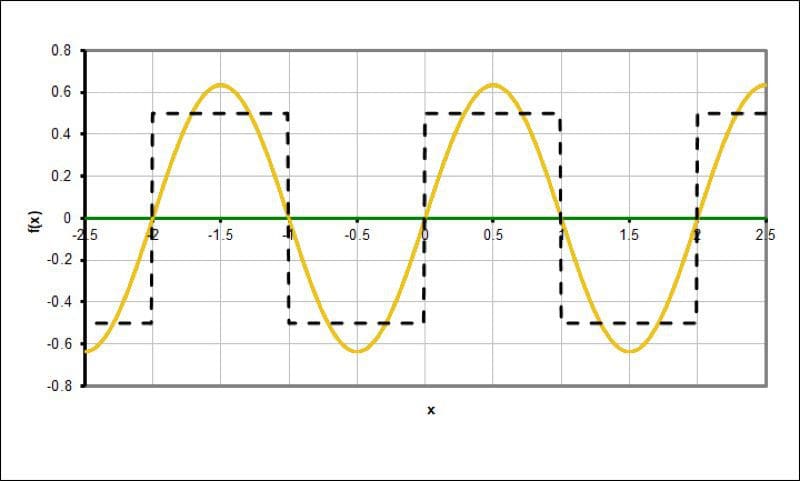 The yellow line shows a single sine wave with no harmonics.
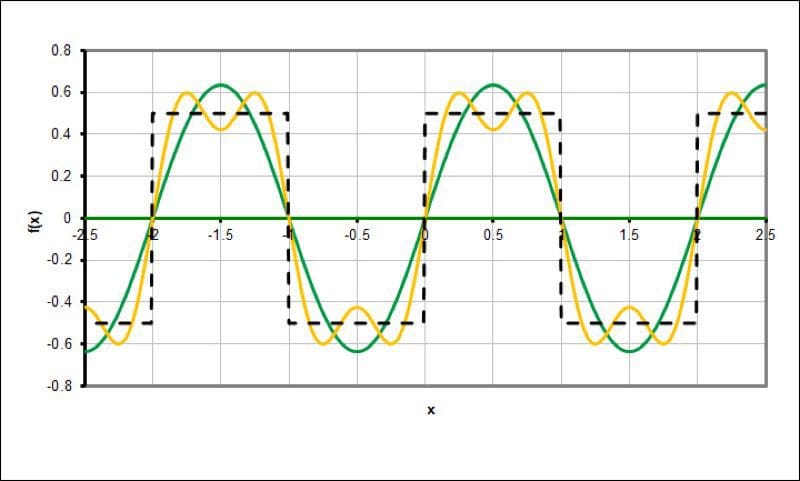 The yellow waveform adds the third harmonic of the fundamental frequency.
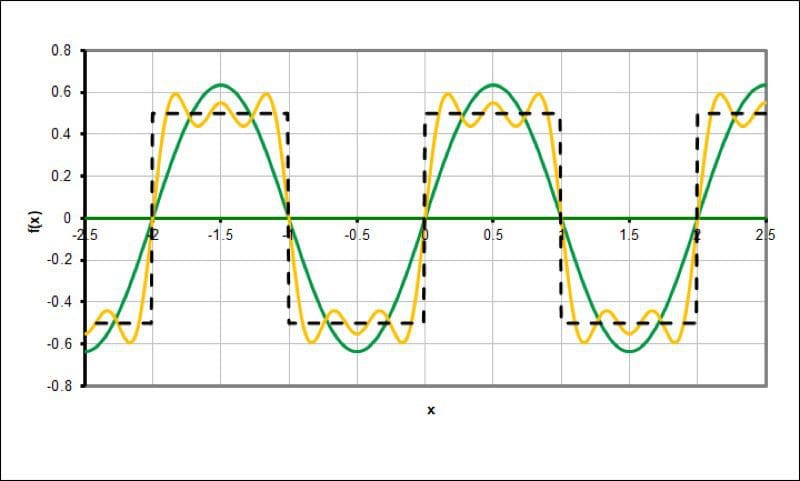 The yellow waveform adds the third and fifth harmonic of the fundamental frequency.
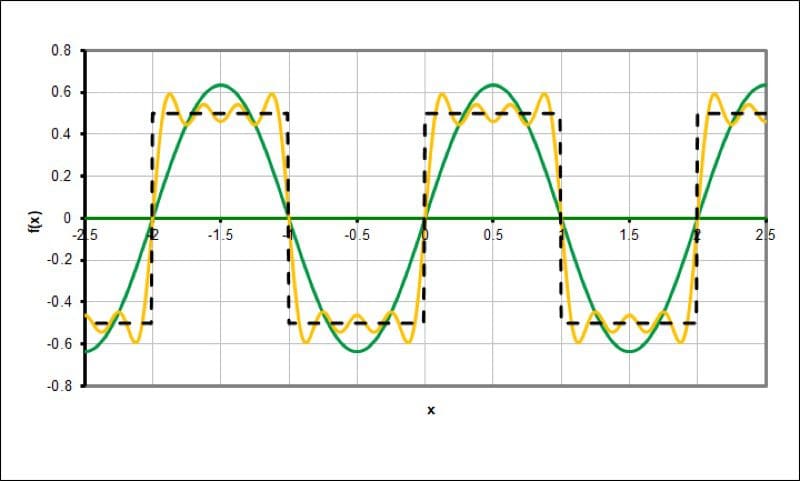 The yellow waveform adds the third, fifth and seventh harmonic of the fundamental frequency.
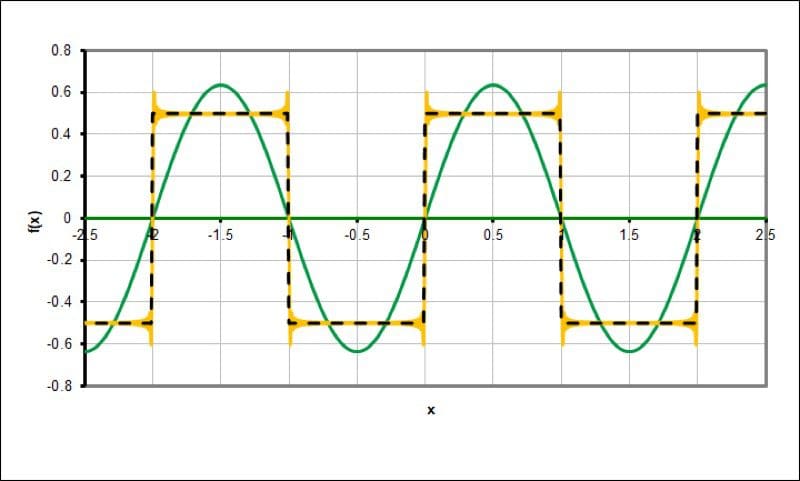 The yellow waveform shows the 100 odd-ordered harmonics as well as the fundamental frequency.
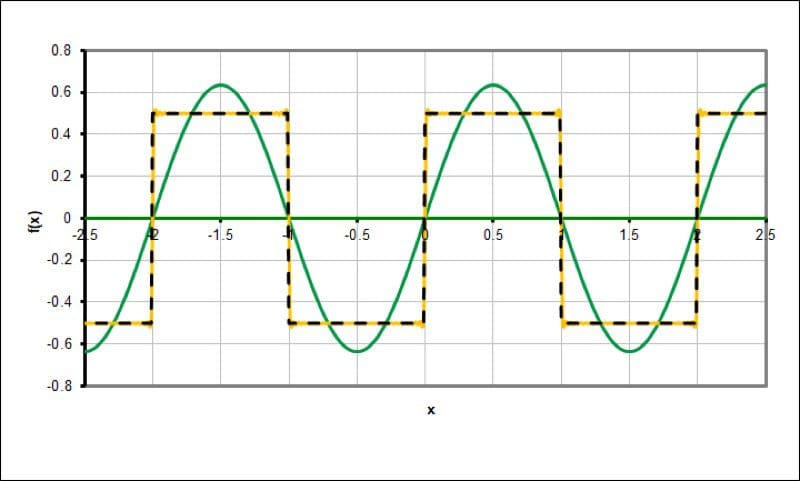 In this graph, we have the fundamental frequency and 256 odd-ordered harmonics added together.
If you have ever wondered why tweeters seem to the be the first to fail when an amp is driven into clipping or distortion, the reason is the addition of high-frequency information to the audio signal. Where we might have been feeding one or two watts to a tweeter with music, a square wave or a waveform containing significant harmonics contains a great deal more high-frequency information.
We hope this wasn’t too much to information for a single article. Understanding waveform amplitude and frequency content are crucial to any discussion of a mobile audio system. In our next article, we are going to discuss the flow of electricity through a conductor and the associated magnetic field that is created.
This article is written and produced by the team at www.BestCarAudio.com. Reproduction or use of any kind is prohibited without the express written permission of 1sixty8 media.


Leave a Reply